Good morning. August’s CPI inflation report comes out tomorrow. As they did last month, gas prices will make the report less frightening than it might have been. But the Fed will, rightly, look through gas prices to things like wages and rents. Fingers crossed for good news there. Ethan is off this week, moving from one tiny New York apartment to another. So I’m the one to email: robert.armstrong@ft.com.
Bad vibes and good returns
People on Wall Street are grouchy. FT Markets editor Katie Martin reports:
Katie is not making this stuff up. Michael Hartnett’s team at Bank of America describes sentiment as “appalling.” Their sentiment indicator (an aggregate combining portfolio positioning, credit market technical indicators, equity market breadth, and capital flows) is pinned to its lowest possible reading, driven by poor breadth and negative flows.
Citigroups’s gauge of sentiment (short interest, margin debt, investors surveys, data from options markets, gas prices, and so on) is falling fast but remains, just barely, in the “neutral” zone between euphoria and panic:
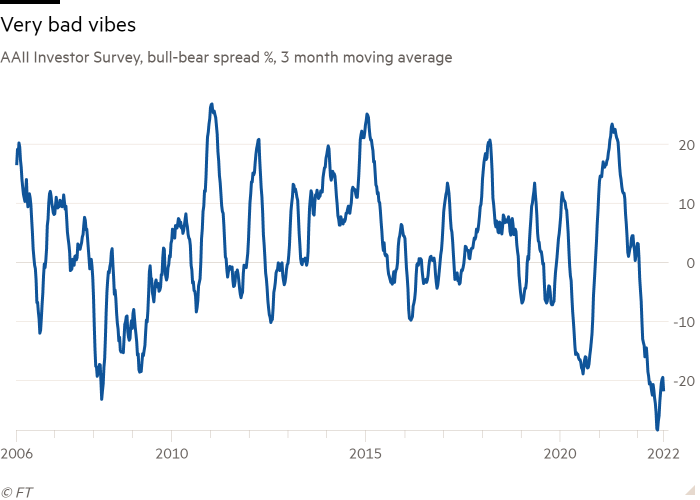
Pulling out one component of the Citi gauge, here is what the venerable AAII individual investors survey says. Below is the percentage of respondents who say they are bullish about the next six months, less the percentage who are bearish. It is indicative of the extreme anxiety inflation causes that back in July this bull-bear spread fell below the trenches of 2008 and 2009. After a bounce, the spread still sits near those lows:
A quick look at the bull-bear spread and subsequent market returns shows that it is a pretty good, but not faultless, contrary indicator. The following chart, of the spread against subsequent 6-month S&P 500 returns, is hard to read. But not impossible. What you are looking for are moments when deep lows in the blue line (sentiment) match up with high highs in the pink line (returns over the following 6 months). There are quite a few of them.
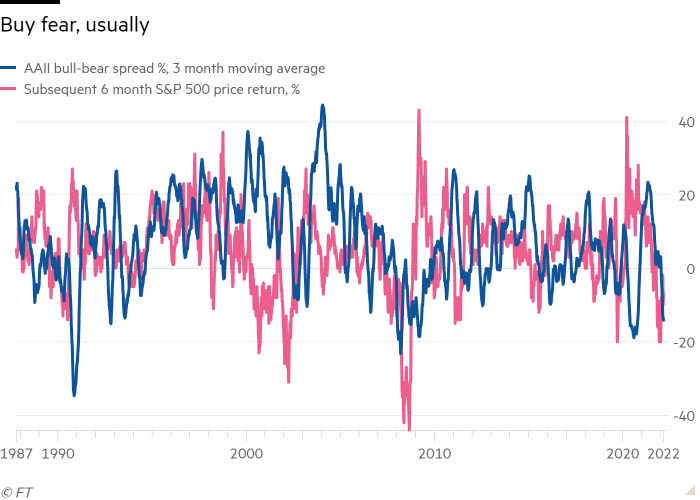
Deep lows in the spread (reading of less than -10 per cent) were associated with notably strong subsequent market performance in 1990, 1992, 1993, 2003, 2006 and 2009. Careful, though. Investors who leapt in on the basis of terrible sentiment in early 2008 got an absolute whipping before things turned around. The same happened, to a lesser degree, to those who chased bad sentiment into the market in the early stages of this year. Very bad sentiment is a pretty good indicator, but not a perfect one (there are no perfect ones).
(If anyone knows a good, independent academic study of the power of the AAII survey, send it along).
Meanwhile, Bloomberg reported last week that record amounts have been flowing into purchases of put options, as investors protect their portfolios from a market collapse:
Prices move when expectations change. When sentiment bottoms out expectations can, by definition, only change for the better. But bad sentiment can get worse. Have we truly bottomed out here?
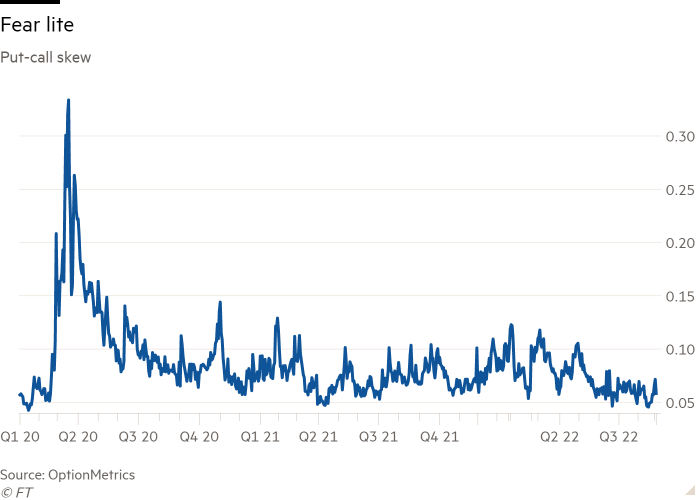
I spoke with Garrett DeSimone, head of research at the options market data provider OptionMetrics, about the elevated put buying mentioned in the Bloomberg piece. He was quite sanguine. Rather than total put money flows, DeSimone prefers to watch put-call skew, which is the difference between the premiums put buyers have to pay for puts and calls with the same expiration.
Below is a chart of skew for S&P 500 options, which is only slightly above zero. “We are seeing increased volume in put activity, but it is not translating into increased pricing of downside risk . . . skew is elevated but nothing crazy.” This is equally true for the index and for heavily traded individual names such as Amazon, Apple, Tesla, and Google. “I wouldn’t call this extreme fear by any means” he says.
Consider also the Vix index, which tracks the expected volatility of the S&P 500, based on options pricing. Again, it’s elevated, but not remotely to the degree of the febrile early pandemic days:
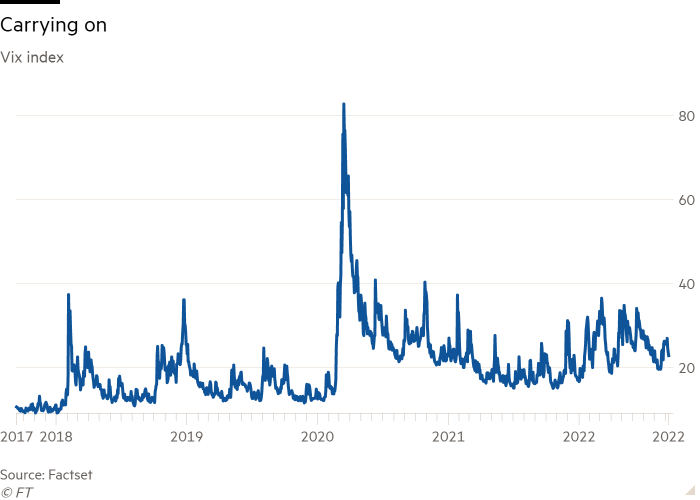
We have something of a mixed picture, then, with wretched investor surveys and ugly flows, but relatively moderate signals coming from the equity options market.
Measures of implied volatility in the bond market — specifically the Ice/BofA Move index, a sort of fixed-income Vix equivalent — have been stuck at very high levels for much of this year. Even here, though, the picture is complex, because realised or expected volatility are not exactly the same as risk appetite. Low liquidity, for example, can lead to high volatility even when risk appetites are robust.
Ed Al-Hussainy of Columbia Threadneedle, Unhedged’s go-to fixed-income nerd, notes that his clients are very keen indeed to get their hands on risky bonds — especially those at the upper end of the junk ratings band.
The frightful sentiment expressed by investors surveys and, to a degree, investor positioning are the most encouraging things about markets right now. But the broader picture is uneven. There are patches of real fear in the market, but it is not pervasive.
One good read
Howard Marks sums up his case against forecasting.


