
Bond markets are flashing a warning signal about the growth prospects for the global economy, just as central bankers prepare to tackle soaring inflation with higher interest rates.
The gap between long-term and short-term government borrowing rates in big developed economies has narrowed drastically since mid-October. For some investors, this so-called flattening of the yield curve is an ominous sign for the durability of the rebound from the Covid-19 pandemic.
“What the market is telling you is that this economic cycle is likely to be much, much shorter than previous ones,” said Mike Riddell, a bond portfolio manager at Allianz Global Investors. “You don’t normally see this kind of flattening so early in the recovery.”
What is a yield curve?
Investors do not have a crystal ball, but the yield curve is the next best thing.
The yield curve shows the interest rates that buyers of government debt demand in order to lend their money over various periods of time — whether overnight, one month, 10 years or even 100 years.
Because lending to governments in big developed economies such as the US, Germany, Japan and the UK is considered a safe bet, these borrowing rates are mostly influenced by investors’ assessment of the prospects for economic growth and inflation, and how those in turn will affect central bank interest rates.
The US yield curve in particular — thanks to the central position of the dollar in the global financial system — acts as a kind of barometer of investors’ collective wisdom about the future path of the world’s largest economy, and has a strong record in signalling downturns before they arrive.
“People get excited about the yield curve because, historically, it has been a good predictor of the onset of recession,” said Richard McGuire, a fixed income strategist at Rabobank.
The yield curve is usually upward sloping, whereby a higher fixed rate of return is earned from lending money for longer periods of time. Shorter-term yields tend to represent what investors believe will happen to central bank policies in the near future. Longer-dated maturities represent investors’ best guess at where inflation, growth and interest rates are headed over the medium to long term.
Yet, when an economy is slowing, and inflation expectations decline, yields on 10- and 30-year bonds typically fall towards those of shorter maturities, such as three-month and two-year notes as bond buyers bet there is less need for central banks to raise borrowing costs in the future.
This so-called flattening in the yield curve can at some point become a recessionary signal; in particular if it becomes downward-sloping or inverted. An “inversion” of the yield curve has preceded every US recession for the past half century.
There are two possible explanations for this predictive power, McGuire explains. One is that the collective wisdom of investors serves as a kind of early warning system, identifying approaching dangers that individual forecasters struggle to spot. The other is that shifts in the shape of the yield curve play an active role in triggering downturns by undermining confidence in the economy.
During periods of economic expansion and very accommodative monetary policy, where governments use low interest rates to encourage spending and boost economic activity, the yield curve steepens. This occurred following the 2008-09 financial crisis and earlier this year, after the pandemic recession.
The rationale for such a shift is that bond investors expect higher yields in the future, because a stronger economy may spur a faster pace of inflation if demand in the economy starts to outstrip supply of goods or labour. In this scenario, the central bank will eventually need to set higher overnight interest rates to encourage people to save more, rather than spend.
Listening to the curve helps draw attention to key points in the data, such as notes descending along the yield curve indicating that it has inverted. It also takes the data to new audiences, helping those who may not be able to see the charts hear them instead.
Yield curve flashed warning sign ahead of financial crisis
What’s been happening with the yield curve more recently?
In 2019, the US yield curve inverted, prompting fears that the long economic expansion following the global financial crisis was drawing to a close.
As it turned out, a recession did follow when the Covid outbreak prompted a shutdown of huge swaths of the global economy. Even the yield curve’s most avid proponents do not claim it can forecast pandemics. Still, we will never know if the US was poised for a downturn anyway, and the predictive power of inversions preserved its stellar track record. That is one reason why investors have been watching recent shifts in the shape of the curve so closely.
Investors were expecting an economic slowdown before the pandemic hit
Early in 2021 the yield curve steepened sharply as investors positioned for a surge in growth and inflation as the economy reopened after the pandemic. The attitude of the Federal Reserve, which has said it would be more tolerant of inflation than in the past, helped to drive this steepening. By keeping rates low in the short term, the central bank would allow inflationary forces to take hold more decisively, the argument ran, which could possibly lead to sharper rate increases further into the future.
Since then, the shape of the curve has been volatile. First, in late spring, longer-dated bond yields fell as investors came round to the view that longer-term growth might tail off sooner than expected, meaning less monetary tightening would be required. At the same time, markets largely swallowed the Fed’s mantra that inflation would be mostly transitory in nature.
The curve started a renewed bout of steepening during late summer, with the market anticipating that the US central bank would announce a “tapering”, or scaling back, of its monthly $120bn bond purchases, mainly of bonds with longer-term maturities.
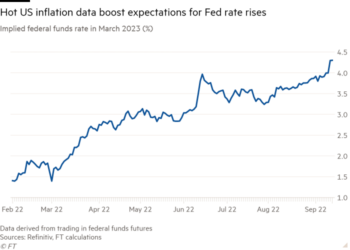
In late September another wave of flattening was driven by the persistence of high inflation, which surprised many investors.
In response, markets have begun betting that the Fed will have to raise rates faster in the short term, pushing short-dated yields higher. At the same time, longer-dated bond yields have fallen, particularly after the emergence of the Omicron coronavirus variant has cast a shadow over the economic recovery. The gap between 10-year and two-year US yields tightened in early December to its narrowest point in about a year, before investors had begun to price in a vigorous rebound in the economy.
To some investors, this latest flattening is a sign that the Fed will only raise rates a small amount, given relatively modest growth prospects in the medium- to long-term. Others go further, arguing it is a sign that aggressive rate rises would be a “policy mistake” that choke off economic growth and therefore leave the central bank needing to cut rates again.
Meanwhile, sceptics say that Fed bond-buying — along with quantitative easing programmes from other central banks around the world — has distorted bond markets and therefore muddied the yield curve’s predictive powers.
Whether or not that turns out to be right, would-be clairvoyants in financial markets are likely to continue gazing at the yield curve.
Explore for yourself: hear how investor expectations played out through the US yield curve
Yields on US Treasuries (%) by starting from
Sources and notes: US Treasury, *The 20-year bond was reinstated in 1993 after being halted seven years earlier due to a lack of buyers: pension plans preferred a longer 30 year maturity, while 20 years was too long for investors who preferred 10 year debts **Following the 9/11 terrorist attacks, the Treasury paused sales of 30-year bonds after deciding to sell more debt with shorter maturities and lower yields; this decision was reversed in 2006 when the Federal deficit had ballooned
Visual Storytelling Team: Caroline Nevitt, Ellen Davies, Sam Joiner and Steven Bernard. Based on Sonification: turning the yield curve into music by Alan Smith